


Overview
This identifies seven observable indicators that a fleet operation is running inefficiently, spanning reactive maintenance patterns, rising downtime, technician productivity loss from parts delays, unexplained fuel cost increases, lack of total-cost-of-ownership visibility, disconnected data systems, and slow or manual reporting processes. Each sign is tied to an underlying operational cause and a corrective practice, such as automated preventive maintenance scheduling, connected work order tracking, and unified reporting across maintenance, fuel, and telematics data.
Most fleets don’t fall apart all at once. They slip a little at a time — a missed service interval here, a technician waiting on a part there, a vehicle that gets replaced a year later than it should have been. None of it looks like a crisis in the moment. But add it up over a quarter, and it’s the difference between a fleet that runs lean and one that’s quietly bleeding money.
The tricky part is that inefficiency doesn’t usually announce itself. It shows up as a slightly higher repair bill, a shop that always feels a little behind, or a nagging sense that nobody has a clean answer when someone asks “what’s this vehicle actually costing us?” Here are seven signs worth paying attention to and what they usually mean when you see them.
1. Maintenance Is Reactive More Often Than It's Planned
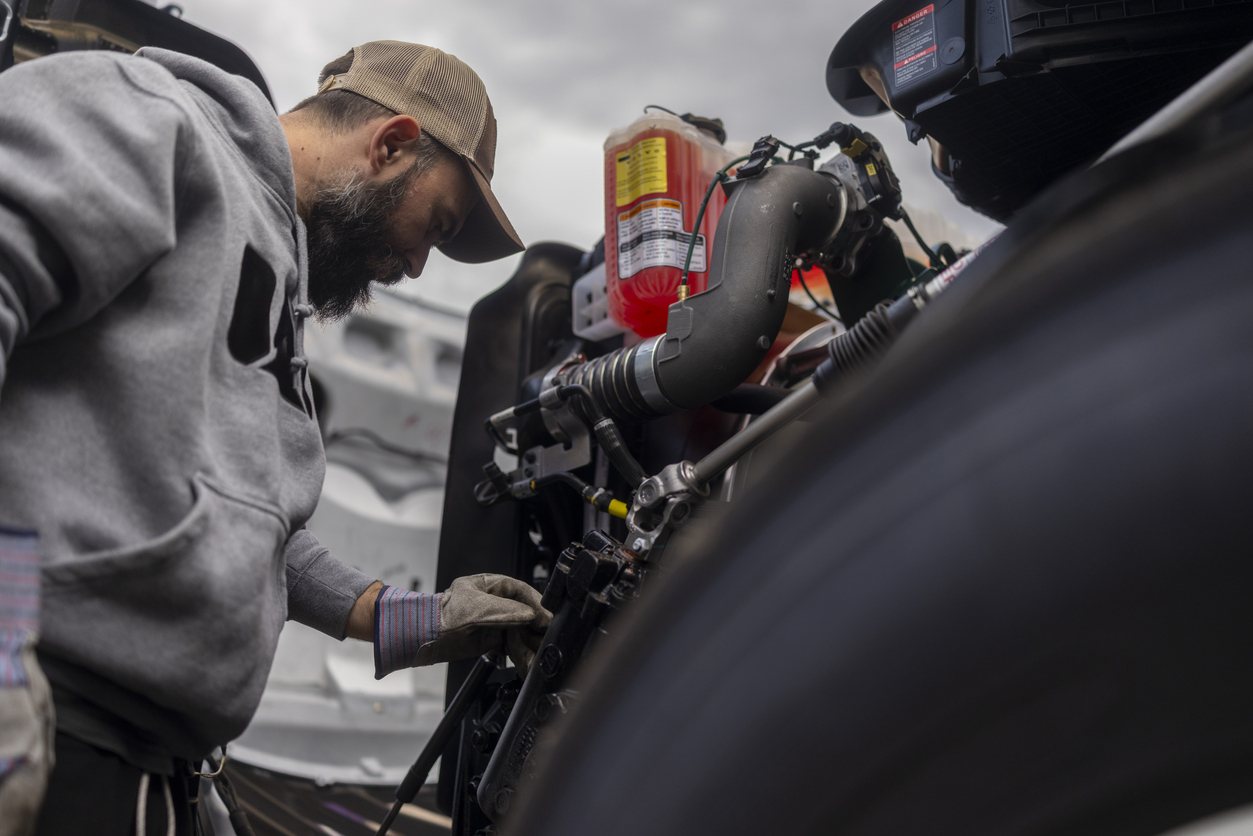
Every fleet deals with the occasional surprise breakdown. But if unplanned repairs are becoming the norm rather than the exception, that’s a signal, not bad luck. A healthy operation runs mostly on scheduled preventive maintenance, with unplanned work as the smaller slice of the pie. When that ratio flips, it usually means PM schedules exist on paper but aren’t being consistently tracked, triggered, or enforced.
The fix isn’t more effort from already-stretched staff. It’s a system that automatically flags vehicles approaching their next service based on mileage, engine hours, or time, so nothing slips through because someone forgot to check a spreadsheet. Automated PM scheduling is one of the more straightforward ways to shift a fleet from reactive to planned and it tends to pay for itself quickly once breakdowns start dropping.
2. Downtime Is Eating Into the Schedule More Than It Used To
Downtime is never free, but it’s easy to underestimate how expensive it is until you look closely. A single day of an out-of-service vehicle costs more than the repair — it costs the lost use of that asset, the schedule shuffling to cover for it, and often overtime or rental costs to fill the gap. For trucking operations, the ripple effects extend to missed delivery windows and strained customer relationships.
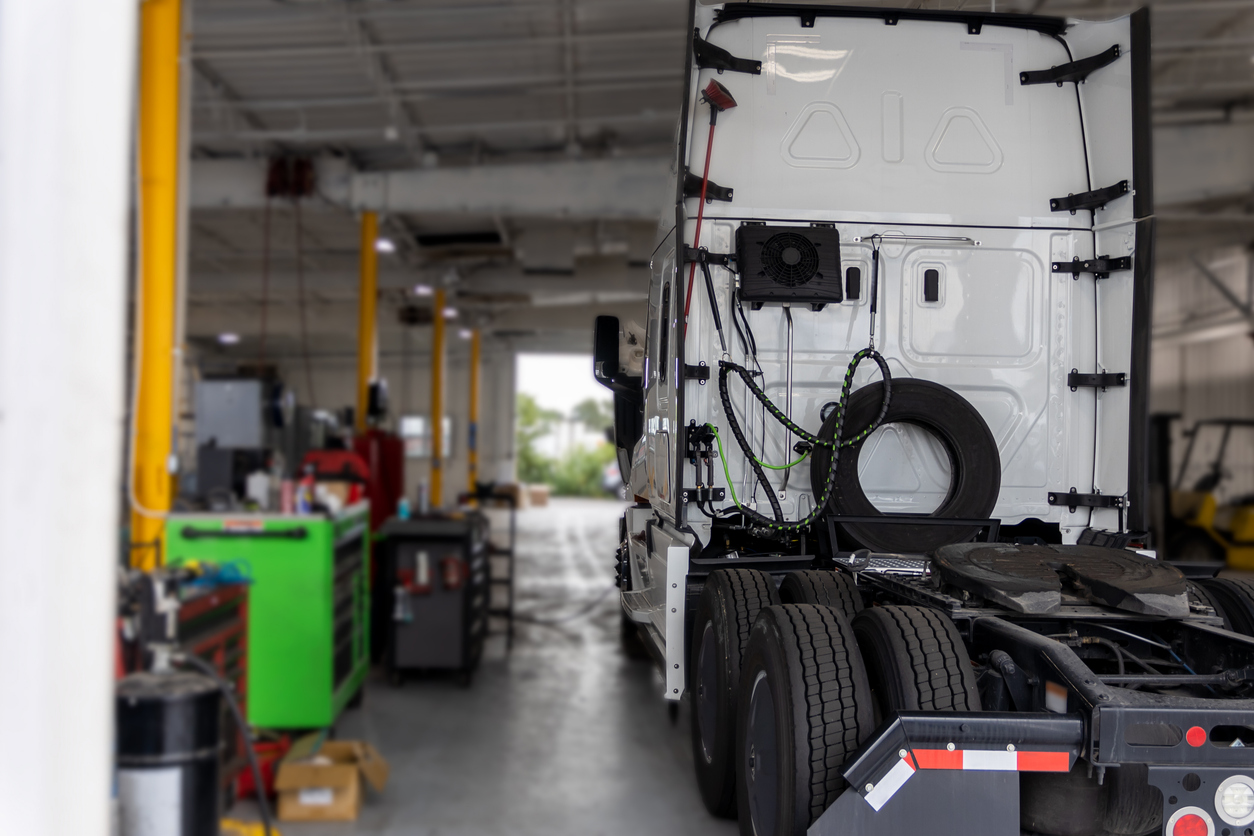
If downtime is creeping up with more vehicles out of service at any given time, or repairs taking longer to turn around, it’s worth asking whether the cause is mechanical or procedural. Often it’s both: aging components that weren’t caught early, and a work order process that doesn’t clearly track where a vehicle sits in the repair pipeline. Visibility into work order status, from intake to completion, makes it much easier to see where time is actually being lost.
3. Technicians Spend More Time Searching Than Wrenching
Ask any shop supervisor what slows technicians down, and parts availability is almost always near the top of the list. A technician waiting on a part or waiting on someone to figure out if it’s even in stock is a productivity problem hiding in plain sight. It doesn’t show up as a line item anywhere, but it shows up in turnaround time.
The same goes for information. If technicians are chasing down vehicle history, prior repair notes, or warranty status instead of having it at the point of work, that’s lost time multiplied across every job. Tying inventory and parts management directly to work orders so a technician can see what’s on hand and what’s on order without leaving the job, closes a lot of that gap.
4. Fuel Costs Are Climbing Without a Clear Explanation
Fuel is one of the largest controllable costs in any fleet, and it’s also one of the first places inefficiency shows up quietly. Well-maintained vehicles run measurably more efficiently than ones falling behind on service — a gap that’s easy to miss vehicle-by-vehicle but adds up fast across a full fleet. Idling time, tire pressure, and deferred maintenance all chip away at fuel economy in ways that rarely get flagged until someone looks at the aggregate numbers.
If nobody’s connecting fuel spend to specific vehicles or routes, it’s hard to know whether rising costs are a market issue or an operational one. Fleets that integrate fuel data directly with maintenance records can actually see those patterns. A vehicle burning more fuel than its peers is often the same vehicle overdue for service, a connection that’s easy to miss when the data lives in two different places.
5. Nobody Can Answer "What Does This Vehicle Actually Cost Us?"
This is one of the clearest tells of an inefficient operation: ask what a specific vehicle costs to operate and the answer takes days to pull together. That’s not a reporting inconvenience. It means replacement decisions, budget requests, and repair-versus-replace calls are being made on gut feel instead of data.
Total cost of ownership only means something if it’s tracked consistently and is easy to pull up. Fleets that keep replacing vehicles too early, or holding onto them too long, are usually the ones without an ongoing view of what each asset costs over its life. Reporting that ties maintenance history, fuel, and downtime together by vehicle turns that guessing game into an actual decision.
6. Fleet Data Lives in Several Disconnected Places
Fuel cards, GPS/telematics, maintenance records, and motor pool schedules often start out as separate systems, each doing its own job well enough. The problem is what happens between them, or rather, what doesn’t. A lot of fleet software still connects these pieces through third-party integration marketplaces, which means multiple vendors, multiple logins, and data that doesn’t always reconcile cleanly.
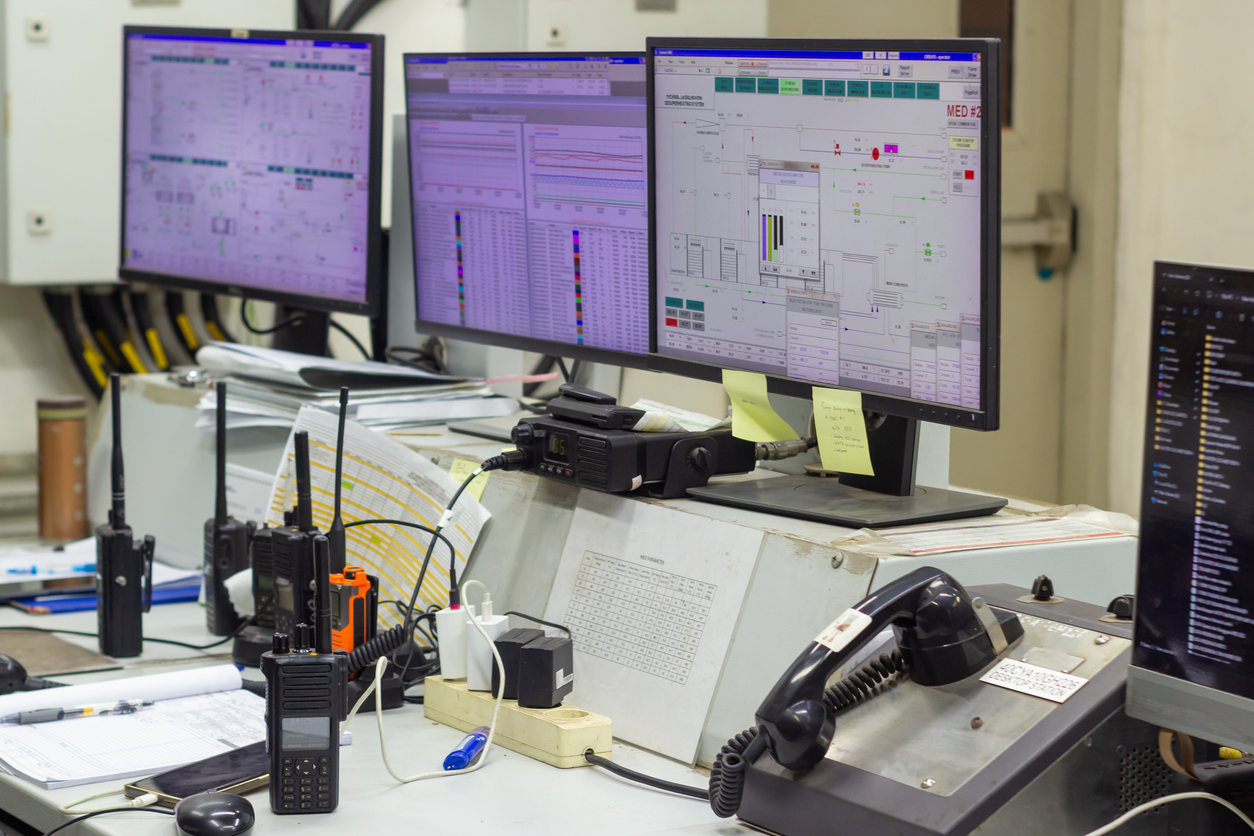
The result is a fleet manager stitching together a picture from several different exports instead of one dashboard. If getting a straight answer about vehicle location, utilization, and maintenance status means checking multiple systems, that disconnect is costing more time than it looks like. A platform where telematics, fuel, and maintenance data are natively connected, not bolted together after the fact, removes a lot of that manual reconciliation work.
7. Reporting Feels Like a Special Project Instead of a Routine Task
If pulling together a monthly report, a budget justification, or a compliance summary feels like a mini-project every time (exporting spreadsheets, cross-referencing numbers, double-checking totals), that’s a sign the fleet is running without the reporting infrastructure it needs. Efficient fleets don’t rebuild their reports from scratch each time; they have dashboards and standard reports that are simply pulled up when needed.
This matters beyond convenience. When reporting is hard, it happens less often, and decisions get made with older or incomplete information. Fleets with 200-plus out-of-the-box reports and configurable dashboards covering maintenance, utilization, and cost can turn what used to be a half-day task into a five-minute pull, which means the data actually gets used to make decisions instead of just filed away.
Bringing It Back Together
None of these seven signs are dramatic on their own. That’s exactly why they’re easy to overlook — each one looks like a minor inconvenience until you notice how many of them are happening at once, and how much time and money they’re quietly costing. The common thread running through all of them is visibility: knowing what’s happening with each asset, each work order, and each dollar spent, without having to hunt for the answer.
That’s the gap that connected fleet and asset management software like FleetFocus is built to close — bringing preventive maintenance, work orders, parts inventory, fuel, telematics, and reporting into one system instead of several disconnected ones. When the data is already connected, the signs of inefficiency show up early enough to act on, instead of showing up in next quarter’s budget review.